Kubernetes GitOps with FluxCD - Part 4 - Helm Chart Automation - Kube Prometheus Stack
Table of Contents
In our previous post, we explored how Flux CD enables automated image updates while maintaining GitOps principles. Building on our foundation of basic Flux CD setup, SOPS-based secret management, and image update automation, this article focuses on Helm Chart Automation - a sophisticated capability that further enhances your GitOps workflow by declaratively managing Helm releases.
Helm serves as Kubernetes’ package manager, simplifying the deployment of complex applications through charts that bundle related Kubernetes resources. While Helm itself is powerful, managing Helm releases manually contradicts GitOps principles of full automation and declarative configuration. Flux CD bridges this gap with its Helm Controller, allowing teams to define, deploy, and update Helm releases through Git-based declarations rather than imperative commands.
This article demonstrates advanced techniques for automating Helm chart deployments with Flux CD, using the Kube Prometheus Stack as a practical example. We’ll explore managing chart dependencies, version control, and environment-specific configurations while adhering to GitOps best practices.
1. Setup Helm Source and Release
First, let’s define a Helm Repository and Release at cluster/default/kps-helm.yaml
 1apiVersion: v1
 2kind: Namespace
 3metadata:
 4  name: monitoring
 5---
 6apiVersion: source.toolkit.fluxcd.io/v1
 7kind: HelmRepository
 8metadata:
 9  name: prometheus-comminty
10  namespace: monitoring
11spec:
12  interval: 30m
13  url: https://prometheus-community.github.io/helm-charts
14---
15apiVersion: helm.toolkit.fluxcd.io/v2
16kind: HelmRelease
17metadata:
18  name: kube-prometheus-stack
19  namespace: monitoring
20spec:
21  releaseName: kube-prometheus-stack
22  interval: 10m
23  chart:
24    spec:
25      chart: kube-prometheus-stack
26      version: "65.8.1"
27      interval: 10m
28      sourceRef:
29        kind: HelmRepository
30        name: prometheus-comminty
31        namespace: monitoring
32  install:
33    crds: CreateReplace
34  upgrade:
35    crds: CreateReplace
36  values:
37    grafana:
38      defaultDashboardsTimezone: "UTC+5:30"
39    prometheus:
40      prometheusSpec:
41        ruleSelector: {}
42        ruleNamespaceSelector: {}
43        ruleSelectorNilUsesHelmValues: false
44        serviceMonitorSelector: {}
45        serviceMonitorNamespaceSelector: {}
46        serviceMonitorSelectorNilUsesHelmValues: false
47        podMonitorSelector: {}
48        podMonitorNamespaceSelector: {}
49        podMonitorSelectorNilUsesHelmValues: false
50        retention: 30d
51        enableOTLPReceiver: true
52        enableRemoteWriteReceiver: true
53        enableFeatures: [otlp-write-receiver]
FluxCD is capable of managing Custom Resource Definitions (CRDs), which is why we’ve configured crds: CreateReplace. This directive instructs FluxCD to automatically create and replace CRDs during subsequent upgrades—a capability we’ll validate later in this post.
Let’s push these changes and monitor the reconciliation process to apply this Helm release:
1flux -n monitoring events --watch
2
3LAST SEEN       TYPE    REASON                  OBJECT                                  MESSAGE
448s             Normal  HelmChartCreated        HelmRelease/kube-prometheus-stack       Created HelmChart/monitoring/monitoring-kube-prometheus-stack with SourceRef 'HelmRepository/monitoring/prometheus-comminty'
547s     Normal  NoSourceArtifact        HelmChart/monitoring-kube-prometheus-stack      no artifact available for HelmRepository source 'prometheus-comminty'
645s     Normal  ChartPullSucceeded      HelmChart/monitoring-kube-prometheus-stack      pulled 'kube-prometheus-stack' chart with version '65.8.1'
744s     Normal  ArtifactUpToDate        HelmChart/monitoring-kube-prometheus-stack      artifact up-to-date with remote revision: '65.8.1'
847s     Normal  NewArtifact     HelmRepository/prometheus-comminty      stored fetched index of size 5.487MB from 'https://prometheus-community.github.io/helm-charts'
90s      Normal  InstallSucceeded        HelmRelease/kube-prometheus-stack       Helm install succeeded for release monitoring/kube-prometheus-stack.v1 with chart [email protected]
Next, let’s access Grafana to verify the deployment:
1kubectl -n monitoring port-forward services/kube-prometheus-stack-grafana 3000:80
2
3Forwarding from 127.0.0.1:3000 -> 3000
4Forwarding from [::1]:3000 -> 3000
Let’s confirm that the default Kubernetes metrics dashboards are functioning correctly:
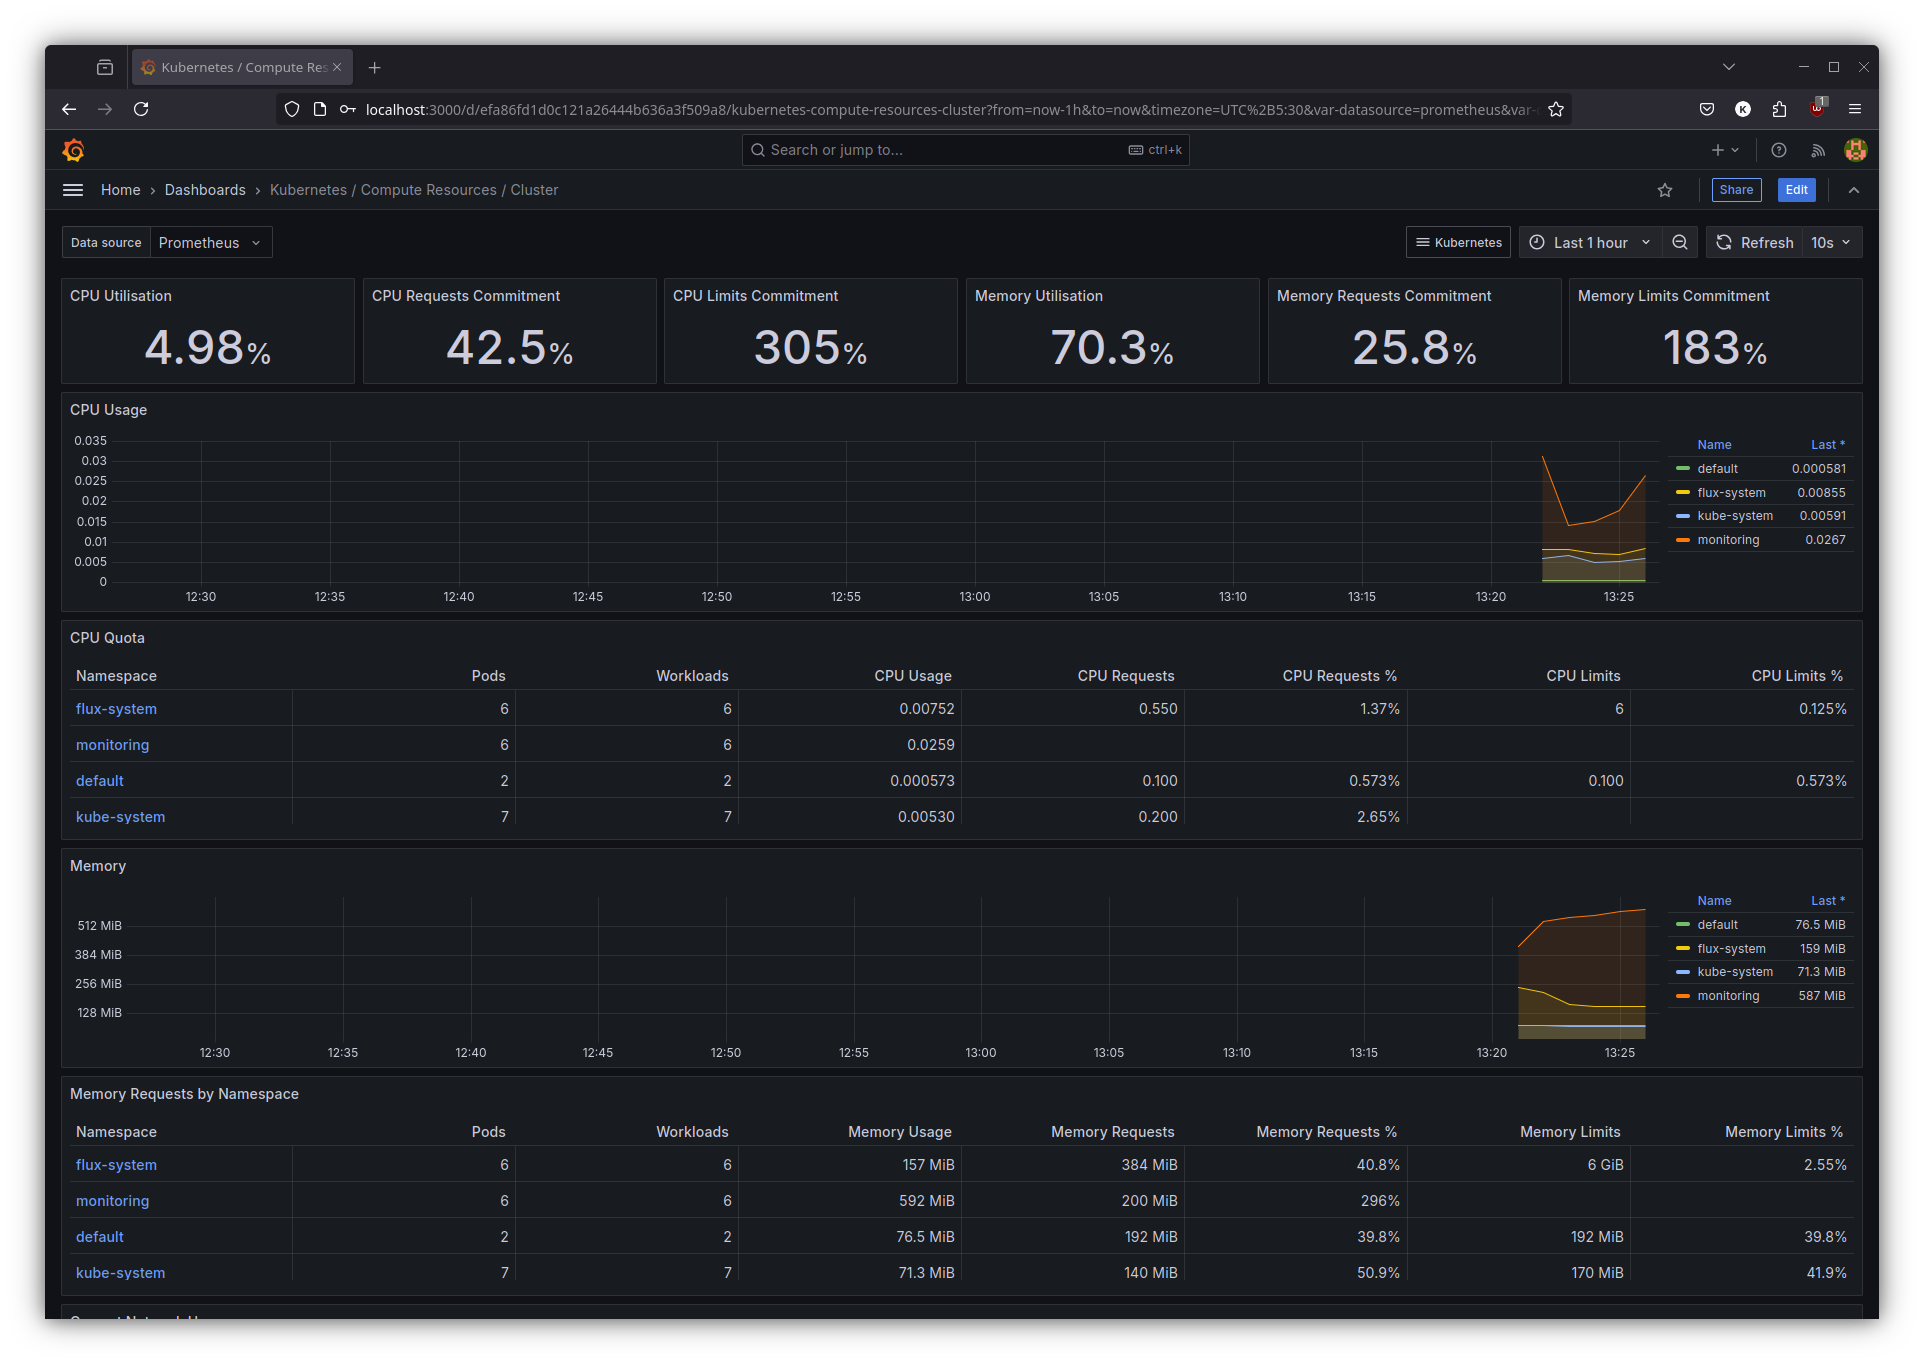
As we can observe, everything is operational and properly configured.
2. Upgrade helm release
We initially configured our Helm release at version 65.8.1. At the time of writing this post, the latest available version is 69.5.2.
According to the official release documentation, one would typically need to manually upgrade the Custom Resource Definitions before performing a Helm upgrade. However, since FluxCD can manage this process automatically, let’s put this feature to the test.
Our approach will be methodical: first, we’ll capture the current CRD state in the cluster, then upgrade the Helm release, and finally compare the new CRD definitions to validate the upgrade process.
Let’s begin by fetching the current CRD:
 1kubectl describe crd prometheuses.monitoring.coreos.com > beforeupgrade.yaml
 2head beforeupgrade.yaml
 3
 4Name:         prometheuses.monitoring.coreos.com
 5Namespace:
 6Labels:       helm.toolkit.fluxcd.io/name=kube-prometheus-stack
 7              helm.toolkit.fluxcd.io/namespace=monitoring
 8Annotations:  controller-gen.kubebuilder.io/version: v0.16.1
 9              operator.prometheus.io/version: 0.77.2
10API Version:  apiextensions.k8s.io/v1
11Kind:         CustomResourceDefinition
12Metadata:
13  Creation Timestamp:  2025-02-27T07:49:22Z
For the next step, we’ll update our Helm Release manifest to version 69.5.2 and push these changes to our Git repository. Then we’ll monitor the reconciliation process:
1flux -n monitoring events  --watch
2
3LAST SEEN       TYPE    REASON                  OBJECT                                  MESSAGE
414s     Normal  ChartPullSucceeded      HelmChart/monitoring-kube-prometheus-stack      pulled 'kube-prometheus-stack' chart with version '69.5.2'
521m     Normal  NewArtifact     HelmRepository/prometheus-comminty      stored fetched index of size 5.487MB from 'https://prometheus-community.github.io/helm-charts'
60s      Normal  UpgradeSucceeded        HelmRelease/kube-prometheus-stack       Helm upgrade succeeded for release monitoring/kube-prometheus-stack.v2 with chart [email protected]
Now, let’s examine if the CRDs were successfully updated during the process:
 1kubectl describe crd prometheuses.monitoring.coreos.com > afterupgrade.yaml
 2head afterupgrade.yaml
 3
 4Name:         prometheuses.monitoring.coreos.com
 5Namespace:
 6Labels:       helm.toolkit.fluxcd.io/name=kube-prometheus-stack
 7              helm.toolkit.fluxcd.io/namespace=monitoring
 8Annotations:  controller-gen.kubebuilder.io/version: v0.17.1
 9              operator.prometheus.io/version: 0.80.1
10API Version:  apiextensions.k8s.io/v1
11Kind:         CustomResourceDefinition
12Metadata:
13  Creation Timestamp:  2025-02-27T07:49:22Z
The results confirm the upgrade was successful. We can observe that the controller-gen version has been updated from v0.16.1 to v0.17.1, and the Prometheus operator version has been upgraded from 0.77.2 to 0.80.1.
Additionally, we can verify that all dependencies have been upgraded as well (as seen in the Grafana version displayed in the screenshot below):
What next ?
In forthcoming articles, we’ll explore more advanced GitOps patterns with FluxCD, including:
- Notification and alerting configuration
- Push based reconciliation triggers with Webhook receivers
Stay tuned for each of these topics.
References
- Official FluxCD Documentation - https://fluxcd.io/flux/guides/helmreleases/
- GitOps Working Group - https://opengitops.dev
- Kubernetes Documentation - https://kubernetes.io/docs/
- Prometheus Operator - https://github.com/prometheus-operator/prometheus-operator
- Kube Prometheus Stack Helm Chart - https://github.com/prometheus-community/helm-charts/tree/main/charts/kube-prometheus-stack
- Helm Documentation - https://helm.sh/docs/